Product Overview
The Automated Drone Image Analysis Tool (ADIAT) is a desktop application featuring a suite of algorithms designed to programmatically identify “areas of interest” in digital images. The primary use case for this tool is to assist in analyzing photos taken by UAVs during search and rescue (SAR) operations, however, the detection algorithms may be applicable to users in many different fields. Given that search teams often operate in austere conditions, ADIAT was built to run without requiring internet connectivity.
Development of ADIAT began in 2017 to support TEXSAR, with input from industry experts. Since its first public release in 2019, ADIAT has continually evolved, adding a user-friendly GUI, major performance upgrades, new algorithms, including AI-based person detection, thermal and video support, and expanded compatibility. Recent updates have further enhanced image viewing and analysis capabilities.
This tool was developed as an open-source project for the SAR community, sponsored by TEXSAR (Texas Search and Rescue).
If you’re interested in contributing to the project, please reach out to us at adiat@texsar.org or check out the source code on GitHub.
Downloads
The technical dependencies required for the AI algorithm significantly increase the installed size of the application. If you do not plan to use the AI algorithm, consider installing the version without it. All other features of ADIAT are the same in both versions.
Version 1.6 (With AI)
Released July 14, 2025 | Last Update July 25, 2025 | Approx. 2.21GB installed
Version 1.6 (Without AI)
Released July 14, 2025 | Last Update July 25, 2025 | Approx. 470MB installed
Interface Guide
The ADIAT interface is built on the QT platform and is comprised of two main components: the “Main Window” where the user provides the inputs required to run the detectors and the “Image Viewer” where the user will be able to see and interact with images were identified as having “areas of interest.” Once the detection algorithm has run, the augmented images with “areas of interest” are also available in the user-selected output folder for viewing outside if ADIAT.
Main Window
- Menu: Provides menu options to load previously completed analysis, update application preferences, and open the video parser.
- Input Folder: Location from which images will be sourced.
- Output Folder: Location where augmented images with “areas of interest” identified will be stored along with an xml file containing metadata from the processing.
- Min Object Area (px): The minimum size (area), in pixels, that an object must meet or exceed to be flagged as an “area of interest.”
- Max Object Area (px): The maximum size (area), in pixels, that an object can be to be flagged as an “area of interest.”
- Object Identification Color: The color that will be used to circle “areas of interest.”
- Max Processes: The number of images that will be processed in parallel. This number is driven by the complexity of the algorithm/features being used and the performance characteristics of the user’s computer.
- Normalize Histograms & Reference Image: The option to adjust the lighting conditions for all input images to where they match the conditions in the reference image. See more about this feature here.
- Use K-Means Clustering & Number of Clusters: The option to leverage K-Means Clustering to reduce the number of colors in the input images. See more about this feature here.
- Algorithm: The detector that will be used. More info about the available algorithms can be found here.
- Algorithm Options: Settings and parameters that are specific to the selected algorithm.
- Start: Button that starts the image analyzer.
- Cancel: Terminates the analysis in progress.
- View Results: Launches the image viewer after analysis has been completed.
- Information Window: Provides real-time updates during the image analysis process.
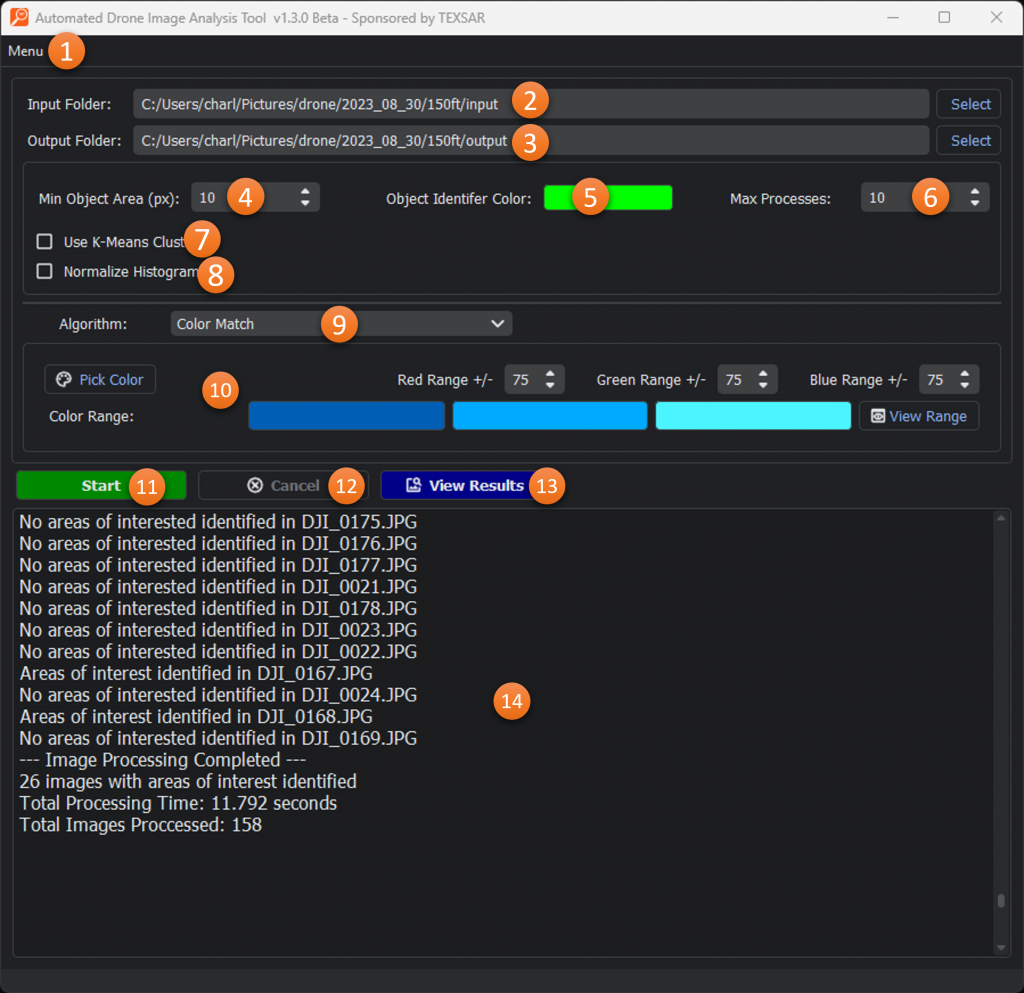
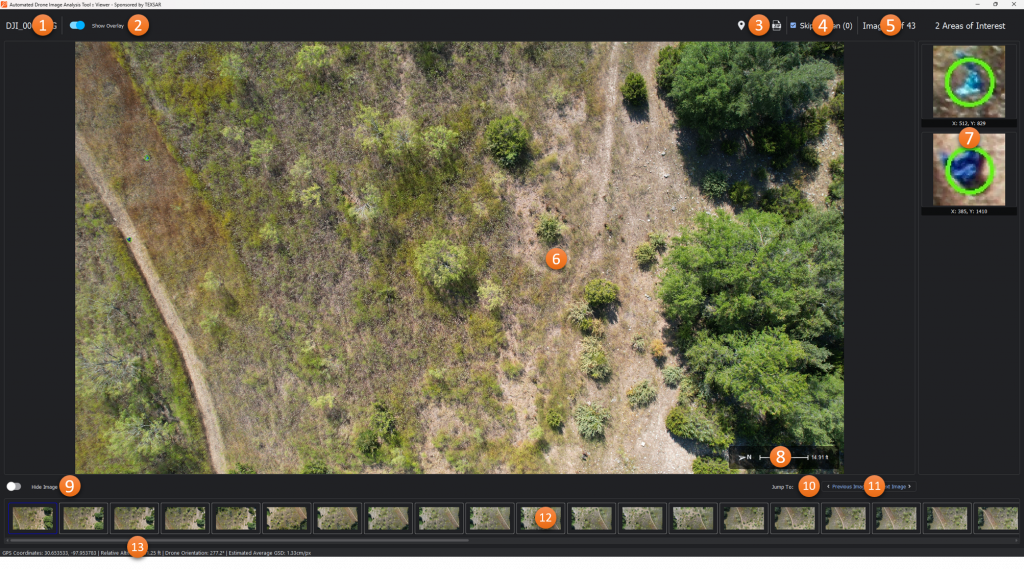
Image Viewer
- File Name: The name of the file currently being viewed.
- Show Overlay: Toggle the direction of travel and scale overlay (#8 below).
- Exports:
– Generate PDF Report: Generates a KML (Keyhole Markup Language) with markers identifying the locations of each image containing “areas of interest.”
– Generate PDF Report: Generates a PDF report with algorithm settings, unhidden output images, and their “areas of interest.”
– Generate Zip Bundle: Generates a zip file with all of the unhidden output images. - Skip Hidden: Toggles whether “hidden” images will be shown when navigation with Previous and Next buttons. Also shows a count of hidden images in the result set.
- Image Count/Index: The index of the current image and the total number of images with “areas of interest.”
- Main Image Viewer: The zoomable image with “areas of interest” circled.
- Area of Interest List: A scrollable section showing thumbnails of “areas of interest” found in the image. Clicking on a thumbnail will zoom the main image to that area.
- Overlay: Shows the drone orientation when the image was taken and a scale based on GSD calculated from the relative altitude.
- Hide Image: Toggle to show/hide the current image
- Jump To: Provides the ability to move directly to a specific image number
- Previous Image & Next Image: Navigation buttons to move between images with “areas of interest” identified by ADIAT.
- Thumbnail Navigation: Scrollable area with thumbnails representing each image with “areas of interest” identified by ADIAT.
- Information Bar: Provides location and altitude data for the image and pixel-level temperature data for thermal images.
Keyboard Shortcuts
| Key/ Combination | Function |
| Left Arrow | Navigation to Previous Image |
| Right Arrow | Navigate to Next Image |
| Down Arrow or P | Hide Current Image |
| Up Arrow or U | Unhide the Current Image |
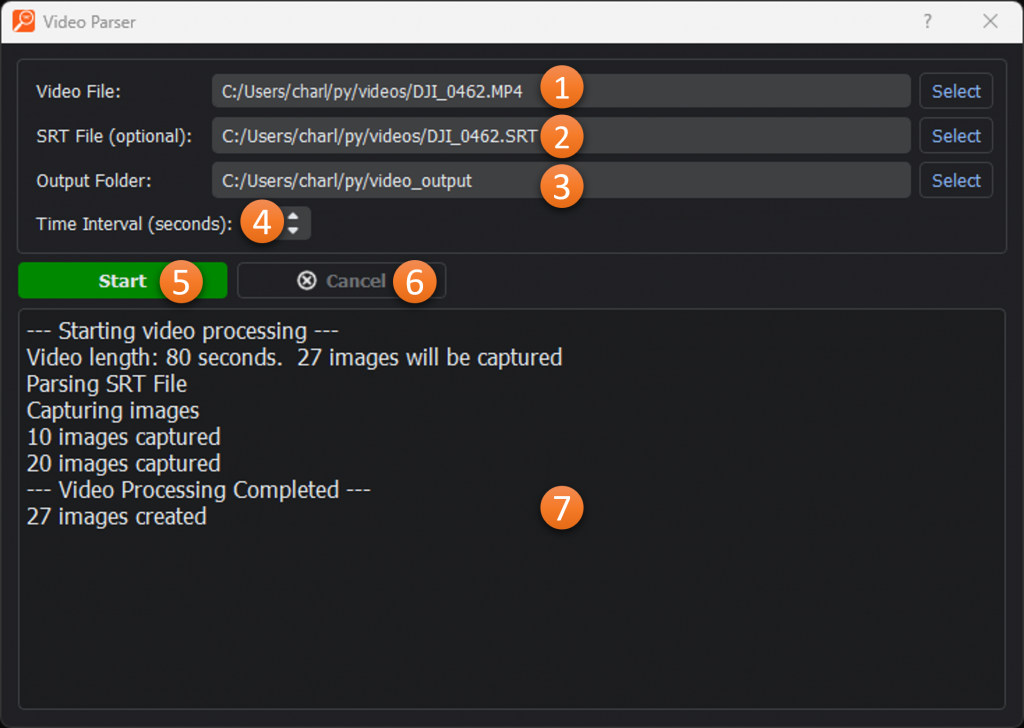
Video Parser
Available from the application menu.
- Video File: The file to be parser.
- SRT File: The SRT file containing timestamp and location information. This is optional, but without it the captured images will not include location information.
- Output Folder: Location where the still frame images will be stored.
- Time Interval (seconds): Interval between still frames to be captured.
- Start: Button that starts the video parsing process.
- Cancel: Terminates the parsing process.
- Information Window: Provides real-time updates during the video parsing process.
Detection Algorithms
ADIAT has been designed so that additional detection algorithms can be added as the fields of computer vision and data science continue to progress. As an open source project, users throughout the SAR and scientific communities are welcome to contribute their expertise to the project through new algorithms and refinement of those that have already been implemented.
The algorithms that have been implemented to date would not be possible without the monumental contributions other have made to freely available resources such as OpenCV, scikit-image, and Spectral Python. Wherever possible we will callout where we have leveraged these libraries as well as the contributions from additional tutorials and guides that make these resources approachable for all users.
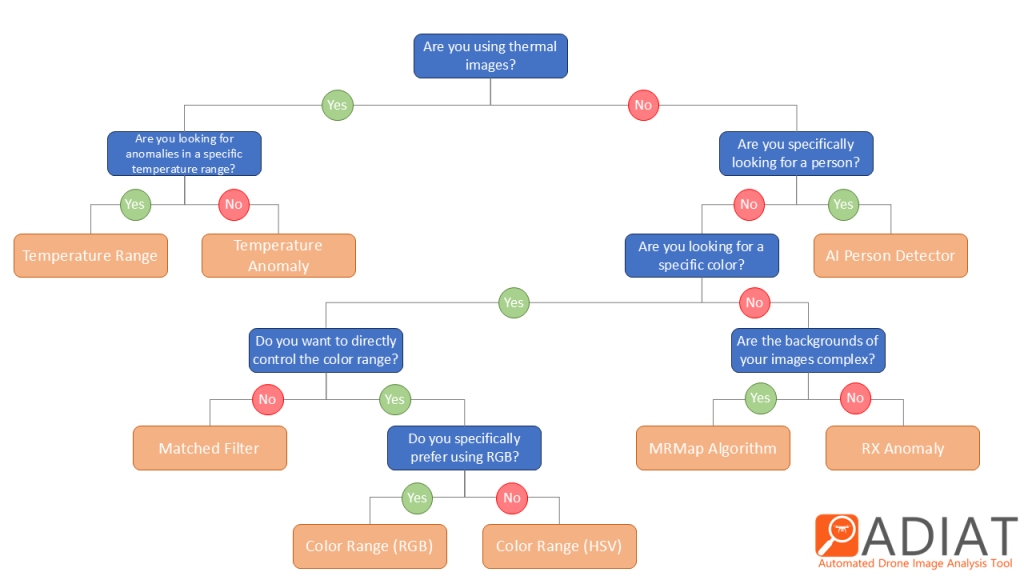
Algorithm Selection Guide
To keep ADIAT user-friendly as we add new algorithms, the following guide will help you choose the most suitable algorithm(s) for your search needs.
RGB Image Algorithms
Color Range (RGB)
Released – May 2019
Available On – Windows, MacOS
Summary
The “Color Range (RGB)” algorithm looks at each pixel in an image to determine if it is within a user-specified RGB color range. Any sufficiently sized (defined by the user) areas where all pixels are within the selected color range are flagged as “areas of interest” in the image.
The color detection algorithm in ADIAT utilizes the inRange function in OpenCV.
Input Parameters
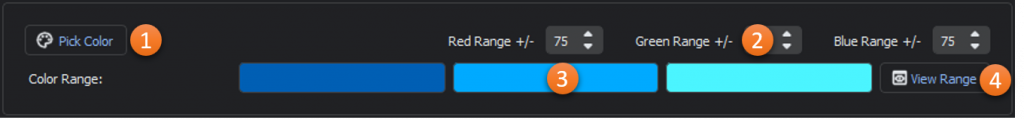
- Reference Color: The base color we will be searching for in the images.
- Color Range Selectors (Red, Green, Blue): Allowed deviation from the selected base color for each color component.
- Color Range Min, Mid, Max: Shows the min, mid, and max color for the selected color rage.
- Color Range Viewer*: Shows the selected and unselected color range in a HSL color maps.
* The color range viewer is a one-dimensional representation of the three-dimensional selected color range. It is intended to be a guide and is not comprehensive.
Libraries, Research, and Tutorials
Color Range (HSV)
Released – July 2025
Available On – Windows, MacOS
Summary
The “Color Range (HSV)” algorithm looks at each pixel in an image to determine if it is within a user-specified color range. Any sufficiently sized (defined by the user) areas where all pixels are within the selected color range are flagged as “areas of interest” in the image.
The color detection algorithm in ADIAT utilizes the inRange function in OpenCV.
Input Parameters
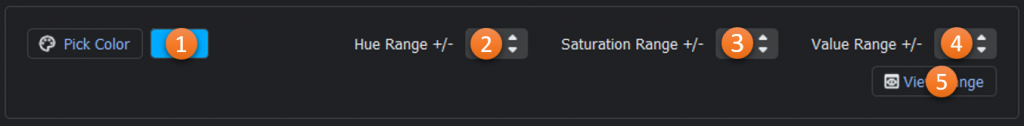
- Reference Color: The base color we will be searching for in the images.
- Hue Range Selector (0-179) Allowed deviation from the selected base color. Hue = what color
- Saturation Range Selector (0-255) Allowed deviation from the selected base color. Saturation = how “strong” or “dull”
- Value Range Selectors (0-255) Allowed deviation from the selected base color. Value = how light or dark.
- Color Range Viewer*: Shows the selected and unselected color range in a HSL color maps.
* The color range viewer is a one-dimensional representation of the three-dimensional selected color range. It is intended to be a guide and is not comprehensive.
Libraries, Research, and Tutorials
Matched Filter
Released – October 2023
Available On – Windows, MacOS
Summary
With the “Matched Filter” algorithm, individual pixels are scored based on how close they are to the reference color and then the scores are evaluated against the user-provided threshold. Any sufficiently sized (defined by the user) areas of pixels scored above the threshold are flagged as “areas of interest” in the image.
The matched filter detector used in ADIAT utilizes the matched_filter function in Spectral Python.
Input Parameters
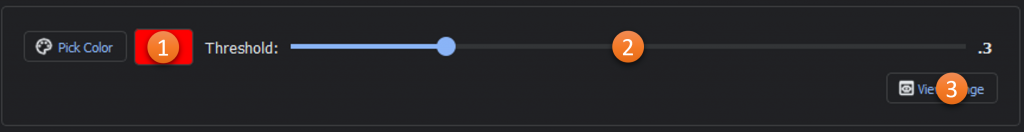
- Reference Color: The color we will be searching for in the images.
- Threshold: Sets the minimum “score” (on a scale of .1 – 1) that we will consider to be a match to the reference color once the matched filter detector is run. Default value is .3
- Color Range Viewer: Shows the selected and unselected color range in a HSL color maps.
Libraries, Research, and Tutorials
RX Anomaly Detection
Released – May 2019
Available On – Windows, MacOS
Summary
The RX (Reed-Xiaoli) anomaly detector extracts targets that are spectrally distinct from the image background by using the squared Mahalanobis distance as a measure of how anomalous a pixel is with respect to an assumed background. Once the RX scores have been calculated, each scored pixel is evaluated against a user-specified threshold to declare whether or not it should declared anomalous. Any sufficiently sized (defined by the user) areas of pixels scored above the threshold are flagged as “areas of interest” in the image.
The RX anomaly detector used in ADIAT utilizes the rx function in Spectral Python.
Note: In previous versions of ADIAT this algorithm was called “Color Anomaly”
Input Parameters
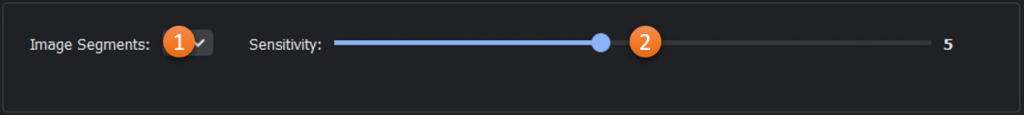
- Image Segments: Divides the image in to equally-sized segments so that the target pixel will be compared to a section of the image rather than the entire image.
- Sensitivity: Threshold for determining if a pixel is anomalous with respect to the background. Default value is 5
Libraries, Research, and Tutorials
- https://www.spectralpython.net/algorithms.html#rx-anomaly-detector
- http://cver.hrail.crasar.org/algorithm/
MRMap Algorithm
Released – February 2025
Available On – Windows, MacOS
Summary
This algorithm is inspired by a color anomaly detector used by Mountain Rescue England & Wales in their MRMap application, which was featured in Wired magazine. The algorithm simplifies the image’s colors into a manageable number of groups using a quantized histogram. It then identifies pixels with colors that are less common than a user-specified level. These anomalous pixels are then checked for proximity to other anomalous pixels, either as neighbors or within a user-defined window. Clusters of anomalous pixels exceeding a user-defined size are flagged as “areas of interest.”
Note: Given that the MRMap algorithm is more aggressive than the other algorithm when it comes to grouping pixels into anomalies, it is recommended that you set you “Min Object Area” higher than you would for other algorithms.
Input Parameters

- Image Segments: Divides the image in to equally-sized segments so that the target pixel will be compared to a section of the image rather than the entire image.
- Window Size: How many pixels away from another anomalous pixel can one be and still be considered part of the same anomaly.
- Threshold: Corresponds to the minimum of pixels in a quantized “bucket” before it is no longer considered anomalous. The threshold is programmatically adjusted based on the image size with an 8000 x 6000 pixel image set as the default reference size (i.e. if your image is 4000 x 3000 the threshold will be 50% of the value you provide since your image is half the size of the reference size
Libraries, Research, and Tutorials
AI Person Detector
Released – July 2025
Available On – Windows, MacOS
Summary
This algorithm leverages a You Only Look Once (YOLO) object detection model that has been specifically trained to identify people in aerial imagery. Images are sliced into 1280×1280 pieces and then processed by the model. Any detections that meet or exceed the user-defined confidence threshold (that is, how confident the model is that it has found a person) are flagged as areas of interest.
Note: This model runs much faster if it can use a GPU (graphics card) that supports CUDA acceleration to make predictions. For more information on how to set up your system for this, click here.
Given that this algorithm is looking for objects (people) it is beneficial to use a higher min object area to avoid false positives.
Input Parameters
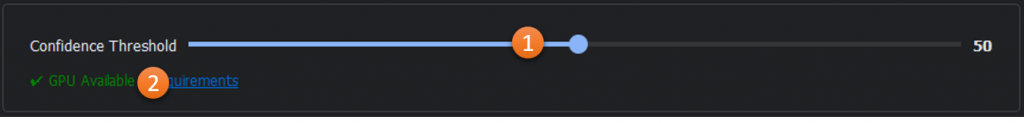
- Confidence Threshold: How sure the model must be (on a scale from 0 to 100) that the object it found is a person, before it is marked as a detection.
- GPU Check: Verification that the user’s system is setup to leverage their GPU for this algorithm.
Libraries, Research, and Tutorials
Citations
- HERIDAL – Dunja Božić-Štulić, Željko Marušić, Sven Gotovac: Deep Learning Approach on Aerial Imagery in Supporting Land Search and Rescue Missions, International Journal of Computer Vision, 2019.
- SARD – Sambolek, Marina Ivasic-Kos, “SEARCH AND RESCUE IMAGE DATASET FOR PERSON DETECTION – SARD”, IEEE Dataport, March 1, 2021, doi:10.21227/ahxm-k331
- WiSARD – Broyles, D.* and Hayner, C.* and Leung, K., “WiSARD: A Labeled Visual and Thermal Image Dataset for Wilderness Search and Rescue”, IEEE/RSJ Int.\ Conf.\ on Intelligent Robots \& Systems, 2022
Thermal Algorithms
Temperature Range
Released – August 2024
Available On – Windows
Summary
The “Temperature Range” algorithm leverages radiometric data capture by thermal sensors and determines for each pixel if it is within a user-specified temperature range. Any sufficiently sized areas where all pixels are within the selected temperature range are flagged as “areas of interest” in the jpg rendering of the thermal data.
Drones/Cameras Supported:
DJI – H20T, H30T, XT2, XTR, XTS, Mavic 2 Enterprise-Advanced, Mavic 3T, Matrice 30T, Matrice 4T
Autel – EVO II 640T v3, EVO Max 4T
FLIR – AX8, B60, E40, T650

Input Parameters
- Minimum Temp*: The bottom of the temperature range
- Maximum Temp*: The top of the temperature range
- Color Map: The color visualization to apply to the rendered jpg.
*The temperature unit can be set in the application preferences.
Libraries, Research, and Tutorials
Temperature Anomaly
Released – August 2024
Available On – Windows
Summary
The “Temperature Anomaly” algorithm leverages radiometric data capture by thermal sensors and determines for each pixel if it is outside of the user-specified number of standard deviations from the mean temperature of all pixels in the image. Any sufficiently sized areas where all pixels are anomalous are flagged as “areas of interest” in the jpg rendering of the thermal data.
Drones/Cameras Supported:
DJI – H20T, H30T, XT2, XTR, XTS, Mavic 2 Enterprise-Advanced, Mavic 3T, Matrice 30T, Matrice 4T
Autel – EVO II 640T v3, EVO Max 4T
FLIR – AX8, B60, E40, T650
Input Parameters
- Anomaly Type: Specifies if anomalies above, below, or above and below the mean should be flagged.
- Anomaly Threshold: The number of standard deviations a pixel must exceed to be considered anomalous
- Color Map: The color visualization to apply to the rendered jpg.
- Image Segments: Divides the image in to equally-sized segments so that the target pixel will be compared to a section of the image rather than the entire image.
Libraries, Research, and Tutorials
Advanced Features
In addition to the detection algorithms, v1.2 of ADIAT includes the addition of two new advanced features which can be leveraged in tandem with any of the algorithms to address common real-world issues that negatively impact the effectiveness of detectors.
Histogram Normalization
Released – October 2023
Available On – RGB Image Algorithms
Summary
Lighting conditions can have a dramatic impact on the representation of colors in an image which, in turn, means that color identification can be problematic with UAV photos when they are taken at different times of day or with variable cloud cover. Histogram normalization addresses this by “standardizing” the lighting conditions across a set of images so that they can be evaluated consistently.
The histogram normalization feature in ADIAT utilizes the match_histograms function in scikit-image.
Input Parameters

- Reference Image: The image that will be used as the baseline against which all other images will be normalized.
Libraries, Research, and Tutorials
K-Means Clustering
Released – October 2023
Available on – RGB Image Algorithms
Summary
K-means clustering is a classification technique designed to group like data points. For the purposes of image analysis, K-means clustering is used to group similar pixels together in order to reduce the overall number of colors represented in an image. Essentially we are reducing the number of colors in the image so we have “one shade of green”, “one shade of brown”, etc. which allows us to isolate anomalous colors.
The K-Means Clustering feature in ADIAT utilizes the kmeans function in OpenCV.
**Warning** This feature is extremally expensive in terms of performance and execution time.
Input Parameters

- Number of Clusters: The number of colors we want to remain in the image after processing.
Libraries, Research, and Tutorials
- https://opencv24-python-tutorials.readthedocs.io/en/latest/py_tutorials/py_ml/py_kmeans/py_kmeans_understanding/py_kmeans_understanding.html
- https://opencv24-python-tutorials.readthedocs.io/en/latest/py_tutorials/py_ml/py_kmeans/py_kmeans_opencv/py_kmeans_opencv.html#kmeans-opencv
- https://medium.com/towardssingularity/k-means-clustering-for-image-segmentation-using-opencv-in-python-17178ce3d6f3
Technical Details
Overview
ADIAT was built in Python and has been compiled into a Windows app and packaged with an installer for portability and ease of use. As an open source program, the source code is freely available in Github along with instructions on how to run and compile the app.
The modular structure of the codebase was designed to allow additional algorithms to be added with minimal changes to the core functions. If you are interested in contributing to this project please contact us at adiat@texsar.org
System Requirements
ADIAT runs on any modern Windows or Mac system. The application can scale memory and CPU usage based on your system’s capabilities, but generally, higher performance hardware will yield faster processing times. ADIAT requires 440 MB of disk space for installation, and you’ll need additional space for any augmented images generated during use.
To leverage a GPU for accelerated AI algorithm performance, an NVIDIA GPU with CUDA support (version 12.x or higher) and cuDNN version 9.x or higher is required. More information on system setup can be found here.
Due to 3rd-party library limitations, thermal algorithms are only available in the Windows version of ADIAT.
License Information
ADIAT is licensed under the GNU General Public License v3.0. This makes it freely available to use by the community with limited conditions.
Release Notes
- 1.6 (July, 2025)
- Added AI Person Detector Algorithm
- Added HSV version of Color Range Algorithm
- Added scale and drone orientation elements to viewer
- Updated logic for calculating object area
- 1.5 (February, 2025)
- Added MRMap Algorithm for RGB images
- Added PDF Report Generator and Zip Bundle generators to Viewer
- Added Max Object Size parameter
- Added support for DJI Matrice 4T
- 1.4 (November, 2024)
- Improved viewer experience with thumbnail navigation and show/hide capabilities.
- 1.3 (August, 2024)
- Added support for thermal images with temperature range and temperature anomaly algorithms
- Added video parser capability
- Overall performance improvements
- 1.2 (October, 2023)
- Added K-Means Clustering and Histogram Normalization features as well as Matched Filter algorithm.
- Performance and detection improvements
- Completed major refactoring and modernization of the codebase
- 1.1 (May 30, 2019)
- First public release including core platform with Color Detection and RX Anomaly algorithms.